This is a guest post by Callum Mundine. Callum is part of a digital marketing agency in Sydney called One Egg. He is an Amazon marketplace & white hat link-building specialist and has launched multiple successful brands. Callum like his eggs boiled.
The benefits of having a social media strategy for your business should be obvious by now. An effective social presence can drive traffic to your website and do wonders for brand awareness, costing very little in terms of dollars spent.
But how do you know if your efforts are “effective,” or whether you could be doing better?
Like every other aspect of your business, you’ll want to analyze and learn from the outcomes of your social media efforts. You don’t just launch a Facebook page, load up a content scheduler and walk away — you build a strategy, implement it, and then track and measure it to make adjustments. Continuous improvement is necessary for success.

Source
Even if you know what data to collect about your site traffic using a tool like Google Analytics, sussing out the interplay between social media platforms in a useful way can be a tricky exercise that nobody has time for. Luckily… Google Analytics offers valuable stats on your social media web traffic.
We’ll show you how to use these statistics in your social media strategy.
Before we start, we’re assuming you have a Google Analytics account. If you don’t, now’s the time to set one up!
Now, log in to your account and let’s dig in.
Create A Social Media Segment
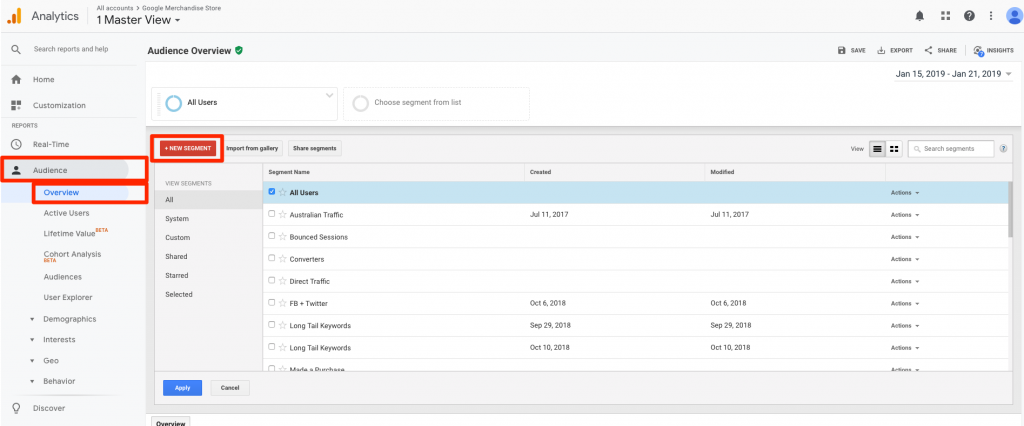
To get started with tracking your social media, the first step is to create a social media segment. To do this, use Advanced Segments, which allows you to define a custom segment of visit tracking selected by source.
Go to:

In the Advanced section, you then choose your Traffic Sources:

Another drop-down menu appears and you select “Contains.”
A text field will appear and then you type in the text that identifies one of your social channels, for instance, “facebook.com.” Then click “OR” to add another field and repeat until you’ve entered all your social media sources.
You can even add blogs, local networking sites or industry forums if you want to track those.
Establish Your Goals
It’s important to establish target numbers as part of your social media strategy (whether you wildly exceed them or scrape by is up to you); try to make them ambitious yet reasonable. This is what you’ll be tracking in Analytics.
Common goals to consider include increased traffic, page views, downloads and dwell times.
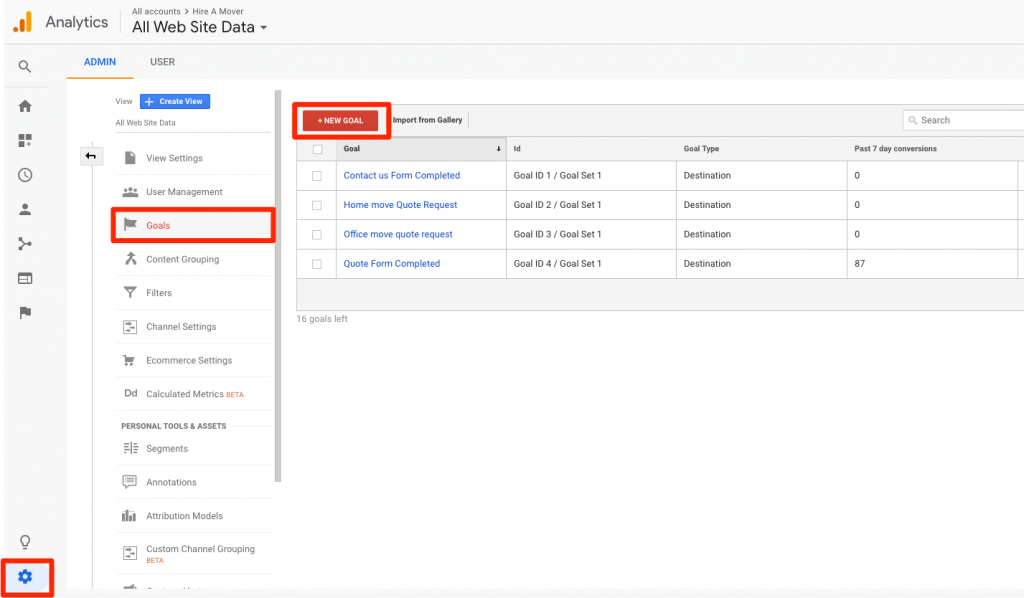
To establish some benchmarks, click on Goals:

You can create a new goal, or edit an existing one. For a new goal, you have the option to use a template, create a custom goal or create a “Smart Goal.”
All of the goals except Smart Goals allow you to assign a value during the setup process. You can use a monetary value, which allows you to compare conversions and track any changes or improvements directly in dollars-and-cents.
Once you’ve set up a social media segment and established goals, it’s time to start tracking and monitoring your progress.
Generating Social Media Reports
After establishing the tracking mechanism, you can go back into your account to monitor progress since you’ll have collected some information to analyze.
To find the social media reports, go to the left sidebar and click on “Traffic Sources.” Choose “Social” from the drop-down menu.
You’ll see a variety of social media reports, and we’ll look at each one.
1) Overview
The first report available to you is Overview, and it’s aptly named. It gives you an overall look at social value and includes details on the following:
- Conversions: The total number of conversions your entire site has received, including every goal from every traffic source — it’s important to note this is not just social traffic. This report also can summarize the total value produced.

- Assisted Social Conversions: These are conversions that have been aided by social media. This number shows you visitors who came to your site from social media at least once. However, they may have arrived via a different source before converting to being a customer. For instance, a customer may click on your Facebook post to visit your site. Then, three days later, the customer returns and completes a goal. That’s counted as an assisted conversion.
- Last Interaction Social Conversions: This number tracks all the conversions produced directly from social media. In other words, visitors arrived at your site via a social media channel and completed a goal during the same visit. It will also report value – if you’ve assigned a value to your goals.
2) Sources
A Sources report will give you details on which social media networks are sending traffic to your site. With this, you can determine where to focus more of your efforts.

Source
You may want to spend your time promoting on those sites that are producing better, or perhaps you want to put more effort into those that aren’t generating as much traffic, to boost them up.
You can also view social media Source Graphs. The graphs allow you to compare and measure traffic from social media (blue graph) versus total traffic (orange graph).
Additionally, the Activity Stream tab displays a report of recent conversations and actions on social networks that are related to your site.
3) Pages
Knowing which pages on your site get the most action in social media traffic enables you to determine what content is most popular on social platforms.
The default Pages view displays pages ranked by number of visits. But you can also see other data, like pageviews, pages per visit and average visit duration.

Source
Note that the Data Hub Activities information in this section is not worth spending much time considering. It only includes the conversions and events from one of the official social networks on the Social Data Hub.
This is only a few social platforms, like Digg, Delicious and Meetup, and will not include data from major networks like Twitter or Facebook. Therefore, the scope of this information is such a small fraction of overall social activity that it isn’t worth focusing on.
Jumper Media’s content creation services help your company or small business stay relevant in today’s social, digital world.
Find out about our Social Media Content Creation Services.
4) Conversions
Beyond the conversion data that you can access in the Overview, this report will break down further detail for each social network.
It will rank your social networks by the number of conversions and, if you’ve applied a dollar value to the conversions, that revenue will also be displayed. Even if you haven’t attached revenue, the number of conversions will still be valuable for you to track.
This report can also give some insight into how social media assists in conversions.
For instance, a platform like Twitter may be more effective at raising awareness of your brand than in getting action. A customer may learn about your business on Twitter, but then they go online days later and find your site via a search engine, go there and make a purchase (or download a file, fill out a form …whatever your goal may be).
In this scenario, the search engine gets credit for the conversion because it’s the most recent traffic source. But Google Analytics can help you determine how social media may have assisted in that conversion, as we mentioned earlier.
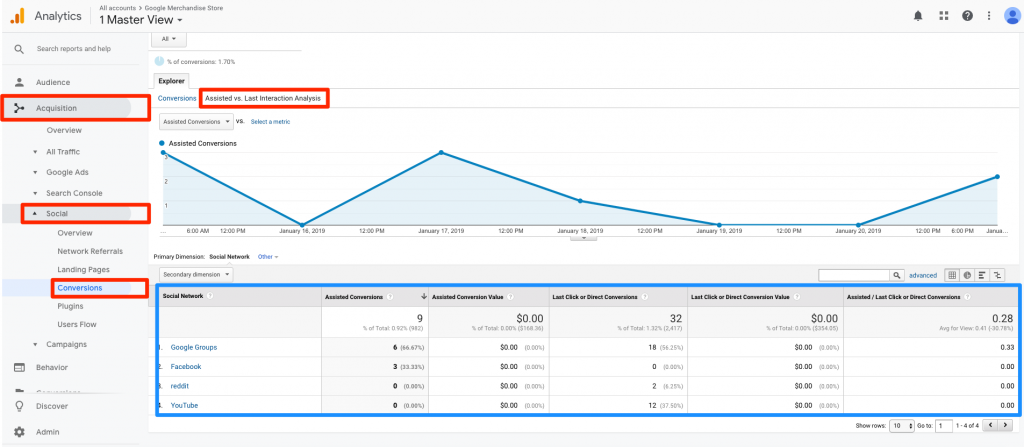
To track detailed Conversion data, look at the Assisted vs. Last Interaction Analysis tab.

Here, you get a wealth of information including:
- Assisted Conversions: This data will tell you when each traffic source brought a visitor to your site but they didn’t convert until a subsequent visit.
- Assisted Conversion Value: The total revenue from those assisted conversions, site by site.
- Last Interaction Conversions: Displays the total conversions completed before visitors left your site.
- Last Interaction Conversion Value: The revenue from the above interactions.
- Assisted/Last Interaction Conversions: This is a ratio that seems a bit confusing at first. If it’s close to 0, it means the traffic source actually creates the conversions. If it’s close to 1, it means there is a balance between assisting and closing the deal. The further above 1 it is, the more a source’s role is to assist conversions.
5 & 6) Social Plugins and Social Visitors Flow
These final two reports are not quite as valuable as the others for most users.
Social Plugins will track social media buttons – but only the Google+ button automatically. You’ll have to configure any other social button in order to track it.
Social Visitors Flow will display traffic from social media, but without the conversion data, it isn’t as useful as other reports available to you and your business.
Final Thoughts on Measuring and Tracking Social Media with GA
You don’t want to be wasting time or money with any aspect of your business, and that includes being sure your social media strategy is effective at getting the results you want.
Google Analytics provides these valuable tools for you to track your online efforts, including social media marketing. We hope you’ll employ them to make the most of your social media campaigns and learn from your experience in the new frontier of business promotion.


